Tutorial videos
Workflow and use-cases are documented in a series of short instructional YouTube videos demonstrating the features of the web application: @Shiny-Calorie.
Flow charts
Statistical testing
For a flow chart on how to select the appropriate statistical test, refer to Fig. Figure 20: Flow chart for selecting appropriate statistical test below.
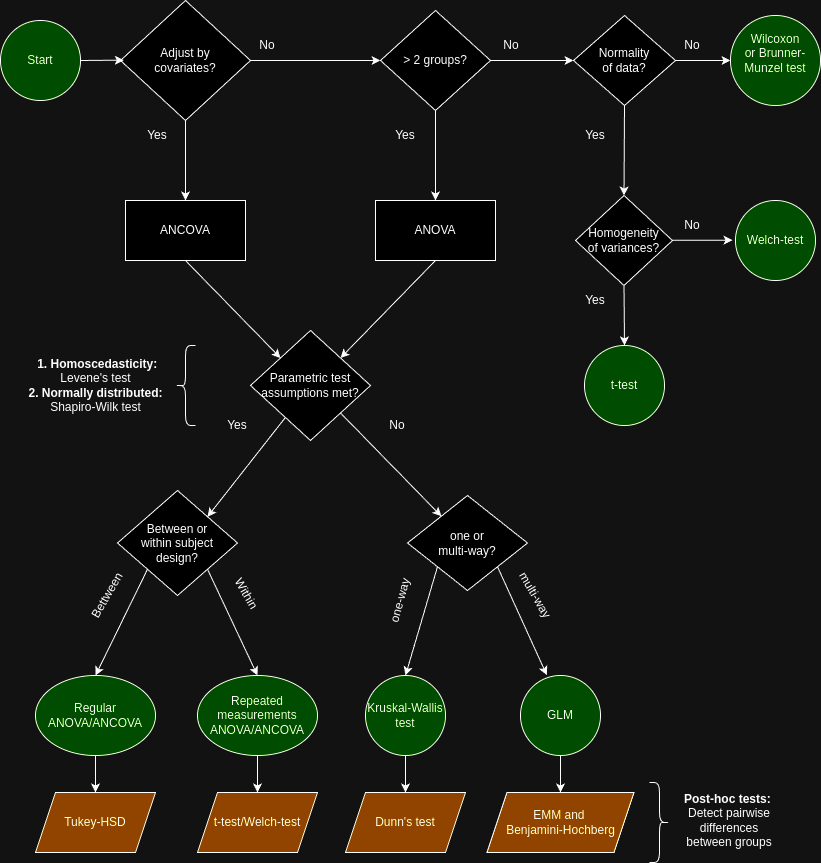
Figure 20: Flow chart for selecting appropriate statistical test