Interface Details
 Image generated using DALL-E by OpenAI. Adjusted by Lea Seep
If you need tab-specific information, navigate to the respective documentation using the left sidebar.
General Design Characteristics
User Interface and Analysis Features
The cOmicsART user interface evolves gradually to guide users through the necessary steps:
- 📥 Data Input Tab: The initial tab where users upload their data. A successful data upload is necessary before accessing the next tab.
- ⚙️ Pre-Processing Tab: This tab becomes accessible after a successful data upload. It offers multiple options to prepare the data for analysis, including diagnostic plots to check for normal distribution.
- 📈 Analysis Tabs: Six analysis options are available, each in its own tab. These tabs provide interactive result visualizations and various analytical functions.
To get more information on the tabs, navigate to the respective documentation using the left sidebar.
Navigation Principles
- 🖱️ Button Clicks: Used to evoke actions.
- ⏳ Loading Bars: Display waiting times during processing.
- ❓ Question Marks: Provide quick help and guide to respective detailed documentation found on this very site.
- 🔽 Dropdown Menus: Offer options for selection. Sometimes multiple items can be selected. If clicking on a selected item it is removed from the selection.
- ☑️ Checkboxes: If a checkbox is clicked, the respective feature is activated. If clicked again, the feature is deactivated.
- 📏 Sliding Bars: Used to adjust numeric parameters or ranges. The range of the sliding bar is displayed above the bar. Simply slide the bar to the desired value.
- 📝 Text Fields: Used to enter text. Within cOmicsART these fields are mostly used to hold your Notes, which are saved in the HTML report at the appropriate position. You can use markdown syntax here.
Features Across Tabs
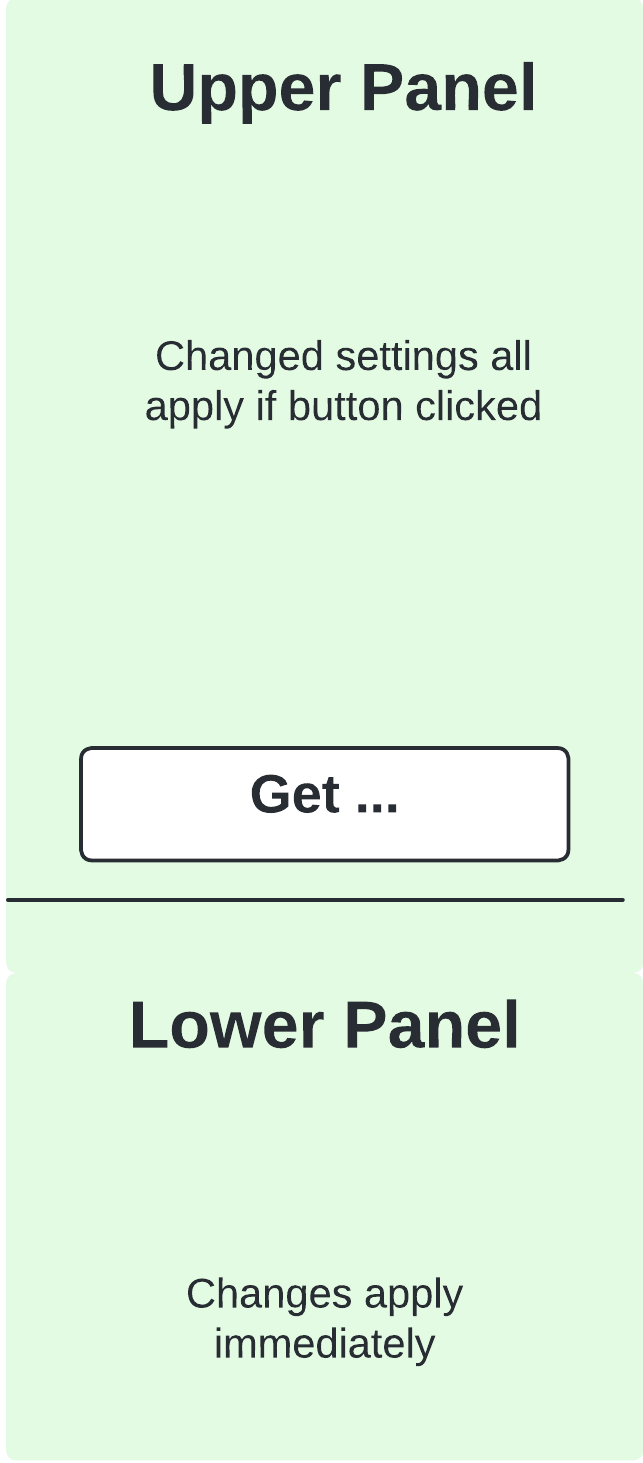
- Side Panel Structure: Each tab, except the input tab, has a side panel divided by a horizontal line:
- Upper Section: Contains options affecting the analysis, requiring recomputation when changed. The analysis is triggered by a “Do/Get analysis” button above the division line.
- Lower Section: Displays secondary parameters with changes reflecting immediately in the results (automatic update).

-
Main Panel Structure: Each main panel contains the visualization of the analysis results. Some panels are further subdivided to show multiple results, for example, the Differential Analysis tab.
-
Picture Download Options: Users can download visualizations and results in common formats (e.g., PNG, TIFF, PDF). There are respective buttons to select the file format. Upon ‘Save plot’ the file is downloaded to the local machine.
-
Sending Visualizations to Report: Upon clicking ‘Send only to report,’ the current shown visualization and associated parameters are saved to the Report. This allows you to experiment with parameters and save the preferred visualization without cluttering the report with all options tried.
-
Get Underlying R Code and Data: Upon button click, the R script and respective data to generate the shown plot will be available for download. The script includes data selection, preprocessing, and analysis. For more details, refer to Code and Data.
-
Notes: At the bottom of each tab, there is a Notes field where you can enter text that will be saved within the report. ()